
Let’s be honest, Google Analytics can be incredibly intimidating. And finding the exact piece of data you’re looking for can feel like looking in a haystack for that proverbial needle. However, never fear! I’m here to break it down into easily digestible chunks, starting with locating demographic and geographic info on your audience.
Why would you need this information? Because within a matter of minutes you can prove that your campaign, or overall marketing efforts, are hitting your target audience and driving real results.
Let’s say you’re a marketing specialist at Dunder Mifflin, a paper company located in Scranton, PA. You’ve been tasked by the world’s best boss, Michael Scott, to run a campaign to get young people between the ages of 18-25 in the state of Pennsylvania to buy more reams of paper.
Based on the campaign objective, you’ve already created a persona for your ideal customer, built a media plan around those persona profiles and have even launched a dedicated landing page to easily track conversions on your campaign.
The campaign will run for a few months, but every couple of weeks it’s a good idea to go into Google Analytics to make sure your target audience is converting into customers.
Here’s how to do it.
On the left navigation, select “Audience,” which will activate a hidden drop-down menu. Under this section, click on “Demographics” which will lead to another hidden drop-down menu. Click on “Overview” and the page to the right will refresh. If no graphs appear, go ahead and click “enable this feature.” It will take 24 hours for Google to populate this section, so plan ahead if you aren’t sure this feature is enabled on your account.

Now, this is where things get tricky.
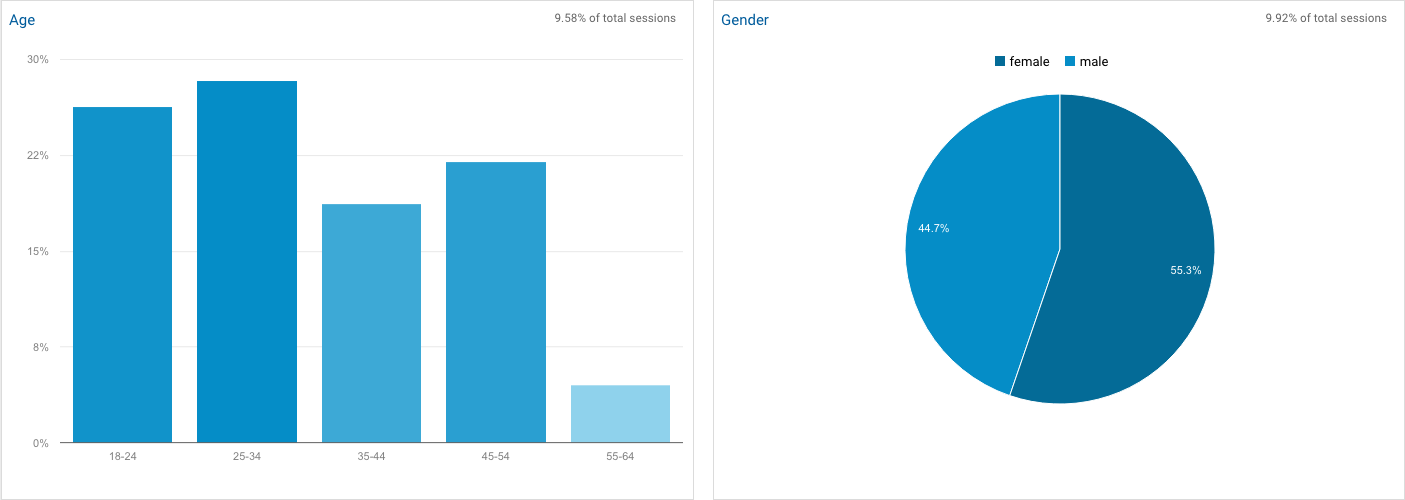
The age bar chart and the gender pie graph are pulling data from your entire website, which means that based on the information below 55.3% of your website visitors are female and most your visitors are between the age of 25-34. While this is great information to have, it doesn’t help if you want to check on a specific campaign landing page. To do that, you need to create an audience segment.
Creating an audience segment
For the novice GA users out there, an audience segment is a super fancy way of saying you want to look at just a portion of your site visitors. Creating a custom segment for this scenario is way easier than it sounds and it should take you under 5 minutes to set it up.
While you’re still on the demographics page, at the very top you’ll see an option to “+Add Segment” (off to an easy start, right?). Now’s here’s where it gets complicated.

This will open a new menu, where you will click on “+New Segment” in the top left corner. From here, name your segment and click on the “Conditions” tab. Since you are monitoring traffic to a specific page on your website, click on the first drop down menu and type in “Landing Page.” Next, change the second drop down menu to “ends with” and add the URL that falls after your domain name. For example, if your campaign landing page is on dundermifflin.com/youngpros then add the “/youngpros” text in the text box.

When you are finished, click “save” which will apply this new segment to the demographic page in Google Analytics. Now you know the age ranges and genders of the people who are making it to your campaign landing page. Super, simple, right? The best part is your segment is saved for future use, no additional steps required.
Finding Location
Now that you have a handle on your audience demographics, you want to make sure your target area is also being reached. I know what you’re thinking… if your business is in Pennsylvania, then so is all your advertising. But thanks to the internet, that’s not necessarily true anymore. Content can go viral in an instant, or a flyer about a great deal on paper can go bicoastal with just the forward of an email. Getting customers from all over is great, but you selected your target audience for a reason, and it’s important to make sure they are picking up what you are putting down.
So, let’s get started. First, head back to the main Google Analytics navigation and click on “Geo,” and then “Location,” under the “Audience” section.

From here, you will be met with a beautiful world map in different shades of blue. The darker the color, the more visitors from that country visited your website. Since you’re a US-based business, go ahead and click on the US on the map, or scroll down and click on “United States” in the listing. This will show you from where in the US your website gets the most visitors. Click on the state of Pennsylvania, or the listing below the map, and you’ll see what cities send the most visitors your way.
Now, once again, this is looking at all visitors to your website. So just go back up to the “+Add Segment” option at the top of the page, find the segment you previously created for this campaign, and hit “Apply.”
And there you have it, in just a few simple steps you can use Google Analytics to provide evidence that your campaign is hitting its target audience. It’s a good idea to check on your campaigns in Google Analytics every couple of weeks to ensure you’re hitting on all your desired KPIs. If you’re not, then checking early and often allows you to make appropriate adjustments.